Marathon race strategy: how to pace every mile from 0 to 26.2
Even, negative or positive split? What 4 million results and the world records show, how to set a target pace from a recent race, and a four-block race plan.
By Abner SantanaCoach and creator of Magic Training
19 min read
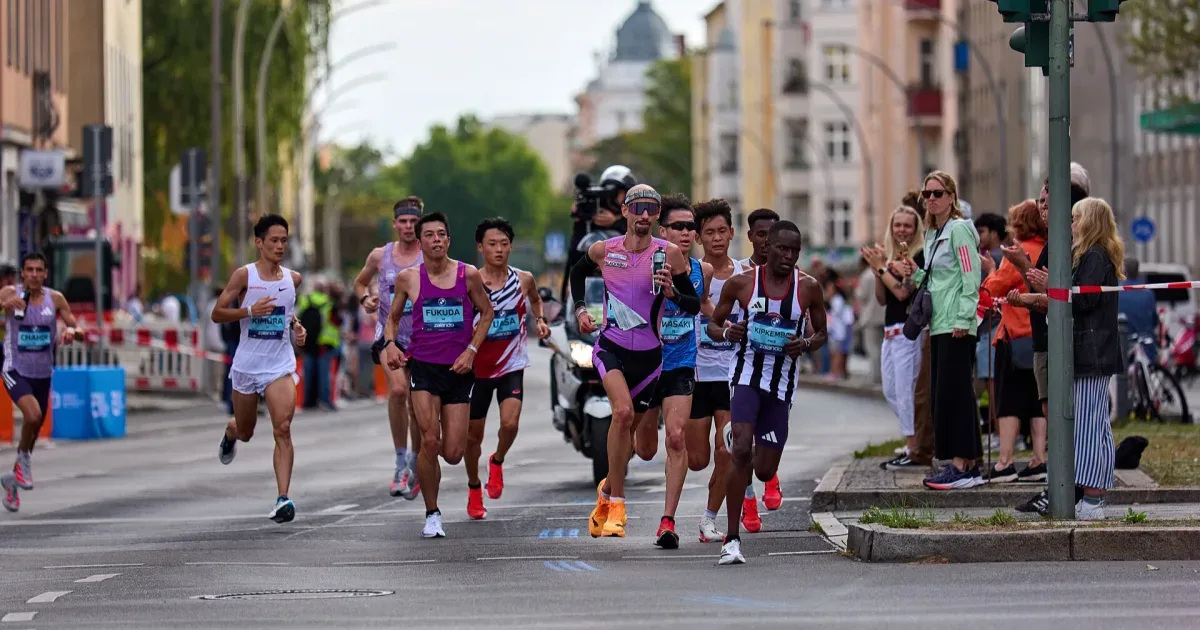
The marathon race strategy with the most data behind it is near-even pacing. The first 5 to 10 km (3 to 6 miles) go slightly slower than target and the middle sits on target pace. The second half finishes no more than 2 to 3% slower than the first. Almost nobody does it. Across 91,929 results from 14 US marathons, men ran the second half 15.6% slower than the first, and women 11.7% (Deaner et al., 2015). Across 4.2 million results from 270 races, 28% of men and 17% of women "hit the wall", at an average cost of 31 to 33 minutes (Smyth, 2021). The last four men's world records, by contrast, were run with the second half within 2.5% of the first.
This guide covers what the big race databases and the records say about even, negative and positive splits. Then how to set a target pace from a recent race rather than from a goal, and what to do in the first 10 km and from 30 km (mile 18.6) onward. After that, how to adjust for heat, course and your watch. It ends with a four-block race plan, with a table. It closes the cycle described in training for a marathon.
Key takeaways
- Near-even pacing is what works. In 190,228 New York City Marathon finishes, every group ran a positive split, and the fastest runners were the most even. World Championship and Olympic medalists run an even pace from 10 km onward.
- Set your target pace from a recent race in the Magic pace calculator, never from your goal. The classic projection from a half marathon was at least 10 minutes optimistic for half of recreational runners.
- Starting fast is the most expensive mistake. Runners who cover the first half above about 94% of their critical speed (the fastest pace you can hold for about an hour) blow up more often. The 100 seconds "banked" in the first 10 km do not cover the 31 minutes a wall costs.
- Heat: male winners run 1.7% slower than the course record at a WBGT (an index combining temperature, humidity and sun) of 5 to 10 °C (41 to 50 °F) and 4.5% slower at 20 to 25 °C (68 to 77 °F); slower runners lose more. A headwind costs more than a tailwind gives back.
- Carbohydrate: 30 to 60 g per hour, and up to 90 g per hour with glucose-fructose blends in races over 2.5 hours, always rehearsed in training.
What the data shows: even, negative or positive split
A positive split means running the second half slower than the first; a negative split is the opposite; an even split is the same time for both. The physiology of sustained effort favors even: in events longer than 2 minutes, a more uniform distribution of pace tends to produce the best time (Abbiss and Laursen, 2008). Amateur practice goes the other way.
What amateurs do
In 190,228 New York City Marathon finishes from 2006 to 2011, every group, by sex and by level, ran a positive split (Santos-Lozano et al., 2014). The difference was in consistency: the top groups varied 7.8% (men) and 6.6% (women) across their 5 km splits; the rest varied between 8.3 and 14.4%. In 14 US marathons in 2011, the average second-half slowdown was 15.6% for men and 11.7% for women (Deaner et al., 2015). The odds of a marked slowdown, with the second half 30% or more slower, were almost three times higher for men.
The extreme version of a positive split is hitting the wall. Smyth (2021) defined the wall as losing 25% or more of base pace, the average between 5 and 20 km, for at least 5 km after the 20 km mark. In 4,183,362 results from 270 races between 2005 and 2019, 28% of men and 17% of women hit the wall. The collapse started on average at 29.6 km (mile 18.4) for men and 29.3 km for women, lasted about 10 km (6 miles) and cost 31.5 minutes for men and 33.2 minutes for women. In the three years before a personal best, 36% hit the wall, against 23% in other years: the price of more aggressive pacing.
What record holders and medalists do
Across the world records from 1967 to 2018, record setters were on average slightly faster in the first half, with a progressive slowdown afterwards, but the effect was small (Díaz, Fernández-Ozcorta and Santos-Concejero, 2018). The record holders of 1967 to 1988 went out hard and faded after 25 km (mile 15.5); those of 1988 to 2018 varied much less. In nine World Championships and Olympic Games, with 673 men and 549 women, medalists ran an even pace from 10 km onward (Hanley, 2016). Those who lost the lead pack did so around halfway. Women slowed less in the second half and ran more negative splits.
The last four men's world records show that the sign of the split matters less than its size.
| Record | First half | Second half | Difference | Source |
|---|---|---|---|---|
| Kipchoge, Berlin 2018 (2:01:39) | 1:01:06 | 1:00:33 | −0.9% (negative) | World Athletics, 2018 |
| Kipchoge, Berlin 2022 (2:01:09) | 59:50 | 1:01:19 | +2.5% (positive) | World Athletics, 2022 |
| Kiptum, Chicago 2023 (2:00:35) | 1:00:48 | 59:47 | −1.7% (negative) | World Athletics, 2023 |
| Sawe, London 2026 (1:59:30, subject to ratification) | 1:00:29 | 59:01 | −2.4% (negative) | World Athletics, 2026 |
Three negative records, one positive, all with the second half within 2.5% of the first. The first record-eligible sub-two-hour time came with both halves faster than Kiptum's: 19 seconds in the first and 46 in the second. In the World Athletics report, Sawe's mark was still listed as subject to ratification.
What this means for you
Pete Pfitzinger and Scott Douglas sum up the rule: relatively even pacing, thinking of the race in two halves and allowing yourself to slow by 2 to 3% in the second (Pfitzinger and Douglas, 2013). The tolerance exists because running economy drops slightly with fatigue. The Hansons method calls the even split the gold standard and tells you to start slower than goal pace (Humphrey, 2026). In the amateur data, a negative split is the consequence of a controlled start, not a goal in itself.
How to choose your target pace: from a recent race, not from your goal
Your target pace comes from a recent race, a 10K or a half marathon raced properly in the last two or three months. Enter the result in the Magic pace calculator and use the marathon pace it returns as your starting point. The goal is what you want; the recent race is what you have. A pace taken from a goal turns the first 20 km into a check that bounces at mile 18.
Magic pace calculator
Find your training paces
Enter a recent race and get the paces for every zone: easy, threshold, interval and race pace.
Calculate my pacesTwo caveats come from the data. First, simple half-to-marathon projections are optimistic. In 2,303 recreational runners, the classic Riegel formula was well calibrated up to the half marathon but gave marathon times at least 10 minutes too fast for half of the runners (Vickers and Vertosick, 2016). Weekly mileage was the second-best predictor: between 50 and 30 miles per week (about 80 and 48 km), the marathon time difference was 25:32 for men and 31:41 for women.
Second, the longer you are out there, the smaller the fraction of your critical speed you can hold. In 31,190 recreational marathoners on Strava, the marathon was run at an average of 84.8% of critical speed (Smyth and Muniz-Pumares, 2020). Those finishing in about 150 minutes ran at 93.0%; those over 300 minutes, at 78.9%.
| Goal | Exact average pace | Pace to finish under | 10 km (6.2 mi) | Half (13.1 mi) | 30 km (18.6 mi) |
|---|---|---|---|---|---|
| 3:00 | 4:15.9/km (6:51.9/mi) | 4:15/km (6:51/mi) | 42:40 | 1:30:00 | 2:07:59 |
| 3:30 | 4:58.6/km (8:00.6/mi) | 4:58/km (8:00/mi) | 49:46 | 1:45:00 | 2:29:18 |
| 4:00 | 5:41.3/km (9:09.3/mi) | 5:41/km (9:09/mi) | 56:53 | 2:00:00 | 2:50:38 |
| 4:30 | 6:23.9/km (10:17.9/mi) | 6:23/km (10:17/mi) | 1:03:59 | 2:15:00 | 3:11:58 |
Splits are for even pace over 42.195 km (26.2188 miles). Rounding matters: 4:59/km gives 3:30:16, and 4:16/km gives 3:00:02. To finish under the goal, use the middle column.
The first 5 to 10 km: the mistake of starting fast
Starting fast is the mistake that costs the most, and how you feel is the trap. Rested from the taper, with adrenaline and a crowd around you, target pace feels slow in the first miles. The data shows the price. Among the 31,190 Strava runners, those who ran the first half above about 94% of critical speed were more likely to lose more than 25% of their pace in the second (Smyth and Muniz-Pumares, 2020). It was 26.0% against 20.5% for men, and 15.6% against 9.6% for women. Runners with an even split sat around 88% of critical speed.
The physiology explains it. Running well above your average race pace for a stretch burns more glycogen than necessary, and that glycogen is missing after 30 km (Pfitzinger and Douglas, 2013). The "banking time" arithmetic does not add up: 10 s/km (16 s/mi) faster over the first 10 km gains 100 seconds. A wall costs 31 minutes on average (Smyth, 2021).
In practice: run the first 10 km (6.2 miles) about 4 s/km (6 s/mi) slower than target, with a little more slack in the first 5 km. That is a deficit of about 40 seconds, recovered by running 2 s/km (3 s/mi) faster in the middle, as in the block plan below. The sign you got it right is finding the pace too easy at km 8 (mile 5). Use the start to find a group or a pacer consistent with your target, and check in the first miles that the pacer is actually holding the promised pace.
From 30 km onward
The wall, when it comes, starts at 29 or 30 km (mile 18 to 19) and lasts about 10 km. In Smyth's (2021) data, the loss was 40% of base pace for men and 37% for women, sustained over 10.7 and 9.6 km. A 70 kg (154 lb) runner stores about 310 g of carbohydrate as glycogen in the legs and about 88 g in the liver, and the marathon needs close to 2,950 kcal (Rapoport, 2010). By Rapoport's model, more than 40% of marathoners get close to severe depletion, and few hit the wall before 11 miles (18 km).
What changes from 30 km onward is that target pace starts to cost more. Running economy drops, and Pfitzinger and Douglas accept a 2 to 3% slowdown in the second half for that reason. Over the final 12.2 km (7.6 miles), that is 62 to 94 seconds for 3:00 and 83 to 125 seconds for 4:00. That is the tolerance, not the goal. Three things help you stay inside it.
First, do not try to recover lost time between 30 and 35 km (miles 18.6 to 21.7); every second recovered there costs glycogen that does not come back. Second, break what is left into 1 or 2 km pieces, with a fixed landmark in each. Third, keep fueling until 38 km (mile 23.6). The training that prepares this stretch is covered in the long run; the week that gets you to the start line rested, in the marathon taper guide.
Adjusting for heat, humidity and the course
The calculator's target pace is for good conditions: cool, flat and calm. Anything else calls for an adjustment before the start, not after mile 15.
Heat and humidity
Temperature is the environmental factor that matters most. In 1,791,972 finishes from six major marathons between 2001 and 2010, the optimal temperature ranged from 3.8 to 9.9 °C (39 to 50 °F) depending on level (El Helou et al., 2012). Withdrawals rose with heat, reaching 30.74% at Chicago 2007 (25 °C, 77 °F).
In seven North American marathons, the male winners were 1.7% slower than the course record at a WBGT of 5.1 to 10 °C (41 to 50 °F) (Ely et al., 2007). The loss was 2.5% at 10.1 to 15 °C (50 to 59 °F), 3.3% at 15.1 to 20 °C (59 to 68 °F) and 4.5% at 20.1 to 25 °C (68 to 77 °F). Slower runners were affected more. In Boston, from 1972 to 2018, each extra 1 °C (1.8 °F) cost all finishers 1:47 and the winners 20 seconds (Knechtle et al., 2019).
WBGT combines temperature, humidity and radiation: in humid air sweat evaporates less and the body cools less. Net of the loss that already exists in ideal conditions (1.7%), heat added about 1.6 percentage points for the elite at 15 to 20 °C and 2.8 points at 20 to 25 °C. Since slower runners lose more, a starting point derived from these numbers is to adjust the target by 2 to 3% at a WBGT of 15 to 20 °C (59 to 68 °F), and by 4% or more above 20 °C (68 °F). In heat, heart rate rises for the same pace; if it is above your usual at km 10, the adjustment needs to be bigger.
Hills
On climbs, what should stay constant is effort, not pace. In runners tested from −45% to +45% gradient, the energy cost of level running was 3.40 J per kg per meter (Minetti et al., 2002). It rises steeply with positive gradient. On descents it falls until about −20% (1.73 J per kg per meter) and rises again on very steep descents (3.92 at −45%), because braking costs energy. Road marathon gradients are small, but the rule is the same: lose a few seconds on the climb at constant effort and recover part of them on the descent, without forcing. Holding target pace on a long climb is the fastest way to bring mile 18 forward.
Wind
On a calm day, air resistance costs about 2% of energy at marathon pace (Davies, 1980). With wind, the math is asymmetric: a headwind costs more than a tailwind gives back. Running about 1 m (3 ft) behind another runner virtually eliminated air resistance and cut oxygen consumption by 6.5% at middle-distance speed (Pugh, 1971). In Boston, a headwind cost all finishers 11:51 relative to a tailwind (Knechtle et al., 2019). Into a headwind, run in a group and take turns; with a tailwind, do not spend the gain by speeding up.
Your watch on race day
Four settings keep your watch a control instrument rather than a source of anxiety.
Average pace, lap pace and manual laps
The instant pace field wobbles with every stride and is the first to lie between buildings. Use two screens: average pace for the race and lap pace. Set manual laps, not auto lap by mile or km, and press the button at every official mile or km marker. That way lap pace is your real time between official marks, whatever the GPS measured. Auto lap drifts away from the markers as the race goes on.
GPS between buildings and in tunnels
In eight sport watches tested, including two Garmin models, the mean absolute percentage error in distance was between 3.2 and 6.1% (Gilgen-Ammann, Schweizer and Wyss, 2020). The worst results came from urban and forest areas, with distances underestimated by up to 9%; on the track the error was small. Between tall buildings the signal bounces and instant pace jumps without you changing anything; in tunnels the watch estimates until it finds the satellites again. On those stretches, run by feel and heart rate until the next marker.
Why the distance "stretches" and how to run the tangents
The course is measured along the shortest possible route, 30 cm (12 inches) from the curb, cutting every bend on the inside (IAAF and AIMS, The Measurement of Road Race Courses). It also gets a 0.1% prevention factor: every measured km is 1,001 m, so the course is never shorter than the official distance. Almost nobody runs that line. In a field study at a German marathon, GPS watches recorded an average of 42.33 km (26.30 miles) (Pobiruchin et al., 2017). Each extra 100 m (110 yards) costs between 25 and 40 seconds at the goals in the table.
Running the tangents means following the measured line: look at the next bend and cross the road in a straight diagonal to its inside, instead of following the curb. With the watch reading more than the markers, its average pace is more optimistic than reality; the reference is always your time at the official markers.
PacePro on a hilly course
On Garmin, PacePro builds a pace band per segment from a distance and a time or pace (Garmin, Forerunner 945 manual). On a known course it distributes effort according to elevation; the plan is built in Garmin Connect, with a preview of the splits. During the race the watch shows the segment's target pace, current pace, distance remaining in the segment and whether you are ahead of or behind schedule. It is worth it on uneven profiles; on a flat course, average pace plus manual laps are enough.
Fueling during the race: the essentials
Carbohydrate during the race exists to spare the glycogen that runs out at 30 km. The consensus range is 30 to 60 g per hour for longer events (Burke et al., 2011). In events over 2.5 hours, the same review allows up to 90 g per hour, with blends of carbohydrates that use different intestinal transporters. A single source, such as glucose or maltodextrin alone, is oxidized at no more than about 60 g per hour (Jeukendrup, 2014).
Above that, you need glucose plus fructose; in a dose-response study, the biggest gain appeared between 60 and 80 g per hour. The ISSN position stand recommends about 30 to 60 g per hour, in doses every 10 to 15 minutes (Kerksick et al., 2017).
In practice: start around km 5 to 8 (mile 3 to 5) and repeat at regular intervals until 38 km (mile 23.6). Check the label for how many grams your gel has and do the hourly math. The gut trains like the legs: Jeukendrup recommends rehearsing the strategy on long runs, to reduce discomfort and increase absorption. Water at the stations, in sips, and never a new gel on race day. The days before are covered in marathon carb loading.
A four-block race plan
The plan below puts it all together: controlled start, middle slightly faster than target pace, tolerance at the end. Target pace (P) is the calculator's, checked against a recent race. Paces are approximate; cumulative times were calculated with the exact pace and land on the goal.
| Block | Pace | 3:00 | 3:30 | 4:00 | 4:30 | What to do |
|---|---|---|---|---|---|---|
| 0 to 10 km (0 to 6.2 mi) | P + 4 s/km (+6 s/mi) | 4:20/km (6:58/mi), 43:20 at 10 km | 5:03/km (8:07/mi), 50:26 | 5:45/km (9:16/mi), 57:33 | 6:28/km (10:24/mi), 1:04:39 | Find your group, pace feels "too easy", first gel at km 5 to 8 |
| 10 to 21.1 km (6.2 to 13.1 mi) | P − 2 s/km (−3 s/mi) | 4:14/km (6:49/mi), 1:30:18 at half | 4:57/km (7:57/mi), 1:45:18 | 5:39/km (9:06/mi), 2:00:18 | 6:22/km (10:15/mi), 2:15:18 | Run the tangents, manual laps at markers, gel every 20 to 30 min |
| 21.1 to 30 km (13.1 to 18.6 mi) | P − 2 s/km (−3 s/mi) | 4:14/km (6:49/mi), 2:07:59 at 30 km | 4:57/km (7:57/mi), 2:29:18 | 5:39/km (9:06/mi), 2:50:38 | 6:22/km (10:15/mi), 3:11:58 | Constant effort on hills, no catching up, keep fueling |
| 30 to 42.195 km (18.6 to 26.2 mi) | P (2 to 3% tolerance) | 4:16/km (6:52/mi), 3:00:00 | 4:59/km (8:01/mi), 3:30:00 | 5:41/km (9:09/mi), 4:00:00 | 6:24/km (10:18/mi), 4:30:00 | 1 to 2 km pieces, last gel at km 38, speed up only after km 40 (mile 25) |
The 4 s/km slower start costs 40 seconds, recovered with 2 s/km less over the next 20 km. If you would rather not "recover" anything, run the middle at pace P and accept finishing about 40 seconds over the goal. In heat or wind, apply the adjustment to P before building the table. The weeks before the race are covered in how many weeks to train for a marathon, and the methods compared in Daniels vs Pfitzinger vs Hansons.
Frequently asked questions
Is a negative split the best marathon strategy?
The best documented result comes from near-even pacing, with the second half within a few percent of the first in either direction. Three of the last four men's world records were negative (−0.9%, −1.7% and −2.4%) and one was positive (+2.5%). For an amateur, a small negative split is the consequence of a controlled start; a large negative split means you started too slowly.
What pace do I need for a 3:30 marathon?
4:58.6/km (8:00.6/mi) on average; in practice 4:58/km (8:00/mi) to finish under 3:30, with the half in 1:45:00 and 30 km in 2:29:18. The block plan suggests 5:03/km (8:07/mi) for the first 10 km, 4:57/km (7:57/mi) to 30 km and 4:59/km (8:01/mi) at the end. It only holds if a recent race, in the Magic pace calculator, points to that pace; the full cycle is in the sub-3:30 marathon plan.
How much should I adjust my pace in the heat?
Male winners ran from 1.7% (WBGT 5 to 10 °C, 41 to 50 °F) to 4.5% (20 to 25 °C, 68 to 77 °F) slower than the course record (Ely et al., 2007), so heat added up to about 3 percentage points. Slower runners lose more. A starting point for an amateur is 2 to 3% at a WBGT of 15 to 20 °C (59 to 68 °F) and 4% or more above 20 °C, with heart rate as the alarm.
Why did my watch read more than 26.2 miles?
The course is measured along the shortest possible route, 30 cm (12 inches) from the curb, plus a 0.1% safety margin; nobody runs that line, and GPS errs more between buildings. In a field study, watches read an average of 42.33 km (26.30 miles) in a marathon (Pobiruchin et al., 2017). Run the tangents and use your time at the official markers as the reference.
References
- Deaner RO, Carter RE, Joyner MJ, Hunter SK. Men are more likely than women to slow in the marathon. Medicine & Science in Sports & Exercise, 2015;47(3):607-16. PubMed 24983344
- Smyth B. How recreational marathon runners hit the wall: a large-scale data analysis of late-race pacing collapse in the marathon. PLoS ONE, 2021;16(5):e0251513. PMC8133477
- Abbiss CR, Laursen PB. Describing and understanding pacing strategies during athletic competition. Sports Medicine, 2008;38(3):239-52. ECU repository
- Santos-Lozano A, Collado PS, Foster C, Lucia A, Garatachea N. Influence of sex and level on marathon pacing strategy. Insights from the New York City race. International Journal of Sports Medicine, 2014;35(11):933-8. PubMed 24886929
- Díaz JJ, Fernández-Ozcorta EJ, Santos-Concejero J. The influence of pacing strategy on marathon world records. European Journal of Sport Science, 2018;18(6):781-6. PubMed 29557279
- Hanley B. Pacing, packing and sex-based differences in Olympic and IAAF World Championship marathons. Journal of Sports Sciences, 2016;34(17):1675-81. PubMed 26736042
- World Athletics. Kipchoge breaks marathon world record in Berlin with stunning 2:01:39. 16 Sep 2018. worldathletics.org
- World Athletics. Kipchoge breaks world marathon record in Berlin with 2:01:09. 25 Sep 2022. worldathletics.org
- World Athletics. Kiptum smashes world marathon record with 2:00:35, Hassan runs 2:13:44 in Chicago. 8 Oct 2023. worldathletics.org
- World Athletics. Sawe breaks two-hour barrier with 1:59:30 world record at London Marathon. 26 Apr 2026. worldathletics.org
- Pfitzinger P, Douglas S. Race-day strategies for marathoners. ACTIVE.com, 9 Sep 2013. active.com
- Humphrey L. Marathon pacing strategies: how to optimize your race performance. Luke Humphrey Running, 16 Apr 2026. lukehumphreyrunning.com
- Vickers AJ, Vertosick EA. An empirical study of race times in recreational endurance runners. BMC Sports Science, Medicine and Rehabilitation, 2016;8:26. PMC5000509
- Smyth B, Muniz-Pumares D. Calculation of critical speed from raw training data in recreational marathon runners. Medicine & Science in Sports & Exercise, 2020;52(12):2637-45. PMC7664951
- Rapoport BI. Metabolic factors limiting performance in marathon runners. PLoS Computational Biology, 2010;6(10):e1000960. PMC2958805
- El Helou N, Tafflet M, Berthelot G, et al. Impact of environmental parameters on marathon running performance. PLoS ONE, 2012;7(5):e37407. PMC3359364
- Ely MR, Cheuvront SN, Roberts WO, Montain SJ. Impact of weather on marathon-running performance. Medicine & Science in Sports & Exercise, 2007;39(3):487-93. PubMed 17473775
- Knechtle B, Di Gangi S, Rüst CA, Villiger E, Rosemann T, Nikolaidis PT. The role of weather conditions on running performance in the Boston Marathon from 1972 to 2018. PLoS ONE, 2019;14(3):e0212797. PMC6407773
- Minetti AE, Moia C, Roi GS, Susta D, Ferretti G. Energy cost of walking and running at extreme uphill and downhill slopes. Journal of Applied Physiology, 2002;93(3):1039-46. PubMed 12183501
- Davies CT. Effects of wind assistance and resistance on the forward motion of a runner. Journal of Applied Physiology, 1980;48(4):702-9. PubMed 7380693
- Pugh LG. The influence of wind resistance in running and walking and the mechanical efficiency of work against horizontal or vertical forces. Journal of Physiology, 1971;213(2):255-76. PubMed 5574828
- Gilgen-Ammann R, Schweizer T, Wyss T. Accuracy of distance recordings in eight positioning-enabled sport watches: instrument validation study. JMIR mHealth and uHealth, 2020;8(6):e17118. PMC7381051
- IAAF, AIMS. The Measurement of Road Race Courses. 2nd ed., 2004, updated 2008. PDF, aims-worldrunning.org
- Pobiruchin M, Suleder J, Zowalla R, Wiesner M. Accuracy and adoption of wearable technology used by active citizens: a marathon event field study. JMIR mHealth and uHealth, 2017;5(2):e24. PMC5350460
- Garmin. PacePro Training. Forerunner 945 Owner's Manual. garmin.com
- Burke LM, Hawley JA, Wong SH, Jeukendrup AE. Carbohydrates for training and competition. Journal of Sports Sciences, 2011;29 Suppl 1:S17-27. PubMed 21660838
- Jeukendrup A. A step towards personalized sports nutrition: carbohydrate intake during exercise. Sports Medicine, 2014;44 Suppl 1:S25-33. PMC4008807
- Kerksick CM, Arent S, Schoenfeld BJ, et al. International Society of Sports Nutrition position stand: nutrient timing. Journal of the International Society of Sports Nutrition, 2017;14:33. PMC5596471
Plans mentioned in this article
Find your plan
Which plan fits your next race?
Answer a few questions about distance, goal and routine and see the plans that fit where you are right now.
Find my plan